Advanced introduction
[1]:
from golem import *

import numpy as np
import pandas as pd
from matplotlib import pyplot as plt
import matplotlib
%matplotlib inline

import seaborn as sns
sns.set(context='talk', style='ticks')
Uncertainty functions implemented in Golem
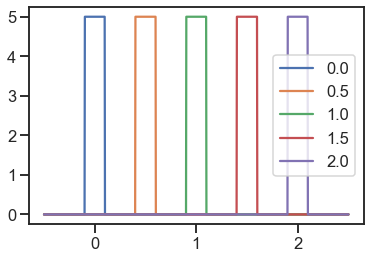
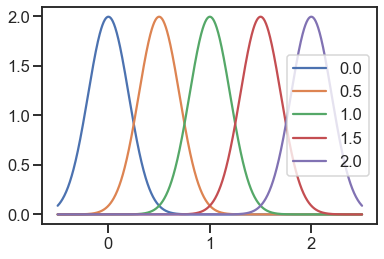
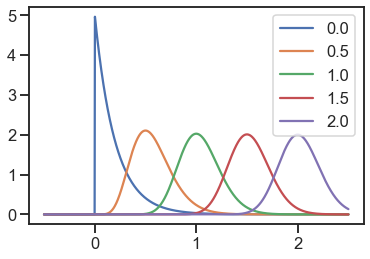
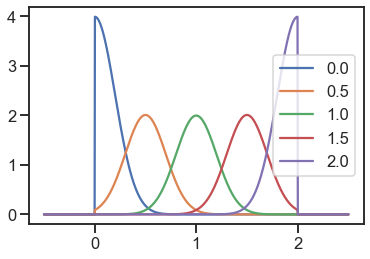
Here we plot some of the probability densities readily availale in Golem.
[3]:
uniform = Uniform(urange=0.2)
normal = Normal(std=0.2)
gamma = Gamma(std=0.2, low_bound=0)
truncated_normal = TruncatedNormal(std=0.2, low_bound=0, high_bound=2)
[4]:
x = np.linspace(-0.5, 2.5, 1000)
locs = np.array([0, 0.5, 1, 1.5, 2])

for loc in locs:
    y = [uniform.pdf(x=xi, loc=loc) for xi in x]
    plt.plot(x, y, label=loc)

plt.legend()
[4]:
<matplotlib.legend.Legend at 0x7fea2d848450>
[5]:
for loc in locs:
    y = [normal.pdf(x=xi, loc=loc) for xi in x]
    plt.plot(x, y, label=loc)

plt.legend()
[5]:
<matplotlib.legend.Legend at 0x7fea2d95ab10>
[6]:
for loc in locs:
    y = [gamma.pdf(x=xi, loc=loc) for xi in x]
    plt.plot(x, y, label=loc)

plt.legend()
[6]:
<matplotlib.legend.Legend at 0x7fea2da8bd50>
[7]:
for loc in locs:
    y = [truncated_normal.pdf(x=xi, loc=loc) for xi in x]
    plt.plot(x, y, label=loc)

plt.legend()
[7]:
<matplotlib.legend.Legend at 0x7fea2db7db10>
One-dimensional example
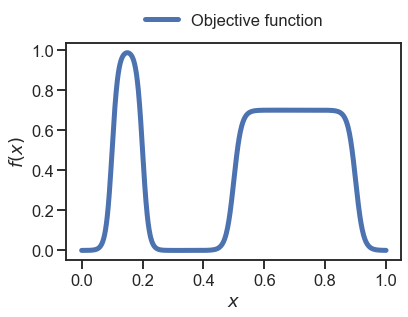
[9]:
def objective(x):

    def sigmoid(x, l, k, x0):
        return l / (1 + np.exp(-k*(x-x0)))

    sigs = [sigmoid(x,  1, 100, 0.1),
            sigmoid(x, -1, 100, 0.2),
            sigmoid(x,  0.7, 80, 0.5),
            sigmoid(x, -0.7, 80, 0.9)
           ]
    return np.sum(sigs, axis=0)
[10]:
x = np.linspace(0, 1, 1000)
_ = plt.plot(x, objective(x), linewidth=5, label='Objective function')
_ = plt.xlabel('$x$')
_ = plt.ylabel('$f(x)$')
_ = plt.legend(loc='lower center', ncol=2, bbox_to_anchor=(0.5 ,1.), frameon=False)
[11]:
# we consider 1000 samples in x
x = np.linspace(0, 1, 1000)
y = objective(x)

# initialise Golem
golem = Golem(goal='max', random_state=42, nproc=1)

# fit the Golem surrogate model - note the argument X takes a 2D array, like the sklearn models
golem.fit(X=x.reshape(-1,1), y=y)

# estimate the robust merits for the same 1000 samples
dists = [Normal(std=0.1)]  # ==> input uncertainty
y_robust = golem.predict(X=x.reshape(-1,1), distributions=dists)
[INFO] Golem ... 1 tree(s) parsed in 66.15 ms ...
[INFO] Golem ... Convolution of 1000 samples performed in 20.35 ms ...
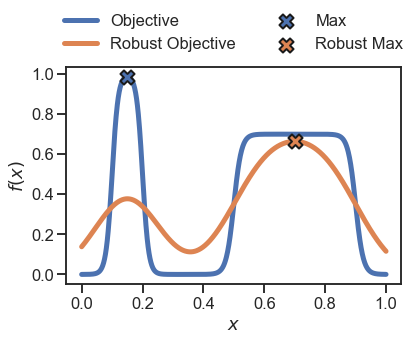
[12]:
plt.plot(x, y, linewidth=5, label='Objective')
plt.plot(x, y_robust, linewidth=5, label='Robust Objective')

# identidy the max locations
plt.scatter(x[np.argmax(y)], np.max(y), zorder=10, s=200, marker='X', edgecolor='k', label='Max', linewidth=2)
plt.scatter(x[np.argmax(y_robust)], np.max(y_robust), zorder=10, s=200, marker='X',  edgecolor='k', label='Robust Max', linewidth=2)

_ = plt.legend(loc='lower center', ncol=2, bbox_to_anchor=(0.5 ,1.), frameon=False)
_ = plt.xlabel('$x$')
_ = plt.ylabel('$f(x)$')
Two-dimensional example
[15]:
def objective2d(x0, x1):
    fx0 = 10 / (1 + 0.3 * np.exp(6 * x0)) + 0.1 * np.abs(2 * x0**2)
    fx1 = 10 / (1 + 0.3 * np.exp(6 * x1)) + 0.1 * np.abs(2 * x1**2)
    return fx0 + fx1
[16]:
N = 51
dists = [Normal(1), Normal(1)]

# prepare data grid
x0 = np.linspace(0, 5, N)
x1 = np.linspace(0, 5, N)
X0, X1 = np.meshgrid(x0, x1)
Y = objective2d(X0, X1)

# put into dataframe
Xy = pd.DataFrame({'x0': X0.flatten(), 'x1': X1.flatten(), 'y': Y.flatten()})
X = Xy.iloc[:, :-1]
y = Xy.iloc[:, -1:]

# compute robust surface
golem = Golem(ntrees=1, random_state=42, nproc=1)
golem.fit(X=X, y=y)
y_robust = golem.predict(X=X, distributions=dists)
Y_robust = np.reshape(y_robust, newshape=np.shape(X0))
[INFO] Golem ... 1 tree(s) parsed in 247.07 ms ...
[INFO] Golem ... Convolution of 2601 samples performed in 728.67 ms ...
[17]:
def plot_contour(ax, X0, X1, y, xlims, ylims, vlims=[None, None], alpha=0.5, contour_lines=True, contour_labels=True,
                 labels_fs=12, labels_fmt='%d', n_contour_lines=8, contour_color='k', contour_alpha=1, cbar=False, cmap='RdBu_r'):
    # background surface
    if contour_lines is True:
        contours = ax.contour(X0, X1, y, n_contour_lines, colors=contour_color, alpha=contour_alpha)
        if contour_labels is True:
            _ = ax.clabel(contours, inline=True, fontsize=labels_fs, fmt=labels_fmt)
    mappable = ax.imshow(y, extent=[xlims[0],xlims[1],ylims[0],ylims[1]],
                         origin='lower', cmap=cmap, alpha=alpha, vmin=vlims[0], vmax=vlims[1])

    if cbar is True:
        cbar = plt.colorbar(mappable=mappable, ax=ax, shrink=0.5)

    # mark minima
    ax.scatter([X0.flatten()[np.argmin(y)]], [X1.flatten()[np.argmin(y)]],
               s=200, color='white', linewidth=1, edgecolor='k', marker='*', zorder=20)

    ax.set_aspect('equal', 'box')
    return mappable
[34]:
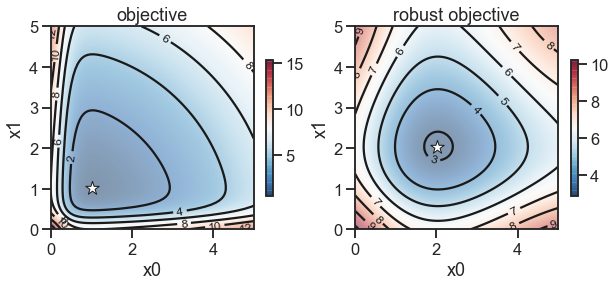
fig, (ax1, ax2) = plt.subplots(nrows=1, ncols=2, figsize=(10, 5))

_ = plot_contour(ax1, X0, X1, Y, [0, 5], [0, 5], cbar=True)
_ = plot_contour(ax2, X0, X1, Y_robust, [0, 5], [0, 5], cbar=True)

_ = ax1.set_title('objective')
_ = ax2.set_title('robust objective')
_ = ax1.set_xlabel('x0')
_ = ax1.set_ylabel('x1')
_ = ax2.set_xlabel('x0')
_ = ax2.set_ylabel('x1')
Estimate using a 8x8 grid
In the examples above, we used a very dense grid. However, in practice, one typically has to estimate the robust objective surface from a limited number of evaluations of the objective function. First, we fit Golem using the 64 available samples…
[22]:
# we assume normally distributed uncertainty in both dimensions with stddev=1
# You can change this to see how it affects the results, e.g. if you use std=0.1 vs 10
dists = [Normal(std=1), Normal(std=1)]

N = 8  # ==> use 8x8 grid to fit Golem model...
x0 = np.linspace(0, 5, N)
x1 = np.linspace(0, 5, N)
X0, X1 = np.meshgrid(x0, x1)
Y = objective2d(X0, X1)

# put into dataframe
Xy = pd.DataFrame({'x0': X0.flatten(), 'x1': X1.flatten(), 'y': Y.flatten()})
X_train = Xy.iloc[:, :-1]
y_train = Xy.iloc[:, -1:]

# compute robust surface
golem = Golem(ntrees=1, random_state=42, nproc=1)
golem.fit(X=X_train, y=y_train)
[INFO] Golem ... 1 tree(s) parsed in 4.64 ms ...
…then, we use the predict method to estimate the whole robust surface.
[24]:
# ==> now predict whole surface on 100x100 grid
N = 100

# prepare data grid
x0 = np.linspace(0, 5, N)
x1 = np.linspace(0, 5, N)
X0, X1 = np.meshgrid(x0, x1)
Y = objective2d(X0, X1)

# put into dataframe
X_pred = pd.DataFrame({'x0': X0.flatten(), 'x1': X1.flatten()})

# expectation of the objective
y_robust = golem.predict(X=X_pred, distributions=dists)
Y_robust = np.reshape(y_robust, newshape=np.shape(X0))

# stddev of the objective
y_robust_std = golem.std_robust
Y_robust_std = np.reshape(y_robust_std, newshape=np.shape(X0))

# tree-based surrogate model used by Golem
y_surrogate = golem.forest.predict(X_pred)
Y_surrogate = np.reshape(y_surrogate, newshape=np.shape(X0))
[INFO] Golem ... Convolution of 10000 samples performed in 82.77 ms ...
[35]:
fig, (ax1, ax2, ax3, ax4) = plt.subplots(nrows=1, ncols=4, figsize=(15, 5), sharex=True, sharey=True)

_ = plot_contour(ax1, X0, X1, Y, [0, 5], [0, 5])
_ = plot_contour(ax2, X0, X1, Y_surrogate, [0, 5], [0, 5], contour_lines=False)
_ = plot_contour(ax3, X0, X1, Y_robust, [0, 5], [0, 5])
_ = plot_contour(ax4, X0, X1, Y_robust_std, [0, 5], [0, 5])

ax1.set_title('true objective\nwith 8x8 grid samples')
ax2.set_title('surrogate model\nestimate from 8x8 grid')
ax3.set_title('robust surrogate\nestimate from 8x8 grid')
ax4.set_title('stddev of robust surrogate\nestimate from 8x8 grid')

ax1.scatter(X_train['x0'], X_train['x1'], s=50, marker='x', color='k', linewidth=2, label='grid samples')

_ = ax1.set_xlabel('x0')
_ = ax2.set_xlabel('x0')
_ = ax3.set_xlabel('x0')
_ = ax4.set_xlabel('x0')
_ = ax1.set_ylabel('x1')

_ = ax1.legend()

Description of the 4 plots above, from left to right:
2D surface representing the objective function (blue=better, red=worse). We assume we sampled only 64 points from this surface and we provide this to Golem.
Golembuilds a surrogate model of the objective function based on the 64 samples using a tree-based model. In this case, a single regression tree, but one can also choose e.g. random forest.
Golemthen uses its surrogate model, together with the specified uncertainty, to “transform” the surrogate into a model of the robust surrogate, which represents the average-case performance of each specific input given the specified uncertainty. We can see that the optimum is shifted away from the “cliff” at low values ofx0andx1.
Finally, Golem can also estimate the expected variance/stddev of the output, i.e. how much is the output going to vary if we choose specific
(x0, x1)values (and assuming the specified uncertainty). Here we can see that low values ofx0andx1have the higher variance, because we are close to the cliff, while for pretty values ofx0>2andx1>2, one can expect lower output variability.
[ ]: